

In the previous tutorial we got to know about what’s new in JMeter 4.0; installed and launched JMeter on MAC OS as well as Windows OS. In this tutorial we will move ahead and will get familiar with JMeter GUI.
Getting Familiar with JMeter GUI
To start with launch JMeter using these two simple steps.
- Go to terminal/Command prompt of your machine.
- Type this command:
- Windows:
<file path>/apache-jmeter-4.0/bin/jmeter.bat - MAC:
<file path>/apache-jmeter-4.0/bin/jmeter.sh
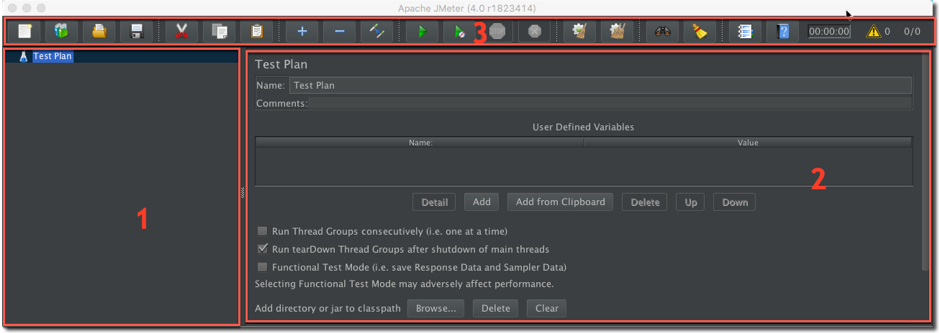
After a few seconds JMeter will Launch and will be seen as below
Note: Please refer our previous tutorial to know in detail about how to launch JMeter
JMeter is primarily divided into three major parts:
- Left Pane : Left pane is the place where the test you want to execute resides.
- Configuration Window : In this window we set the configuration and control the behaviour of the tests that we want to execute.
- Menu Bar : It is an intuitive menu bar from where you may perform all the functions.
The options menu has been removed from the GUI in JMeter 4.0. So, the user may perform nearly all the functions using the buttons present in the Menu Bar.
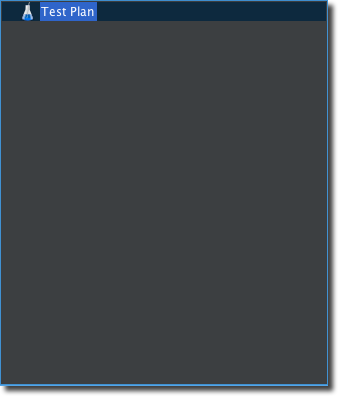
Left Pane
Left pane in JMeter consists of a node known as Test Plan. As the name suggests, Test Plan can be thought of as a container that consists of test scenarios as well as test data.
Similarly, JMeter Test Plan also can be thought of as a container that consists of series of steps that will execute when we run a test plan. Test plan can consist of one or more elements like Thread Groups, Logic Controllers, Configuration Elements, Samplers, Timers, Listeners and Assertions which we will all cover in the later tutorials.
Note: Only one test plan is executed at a time in JMeter.
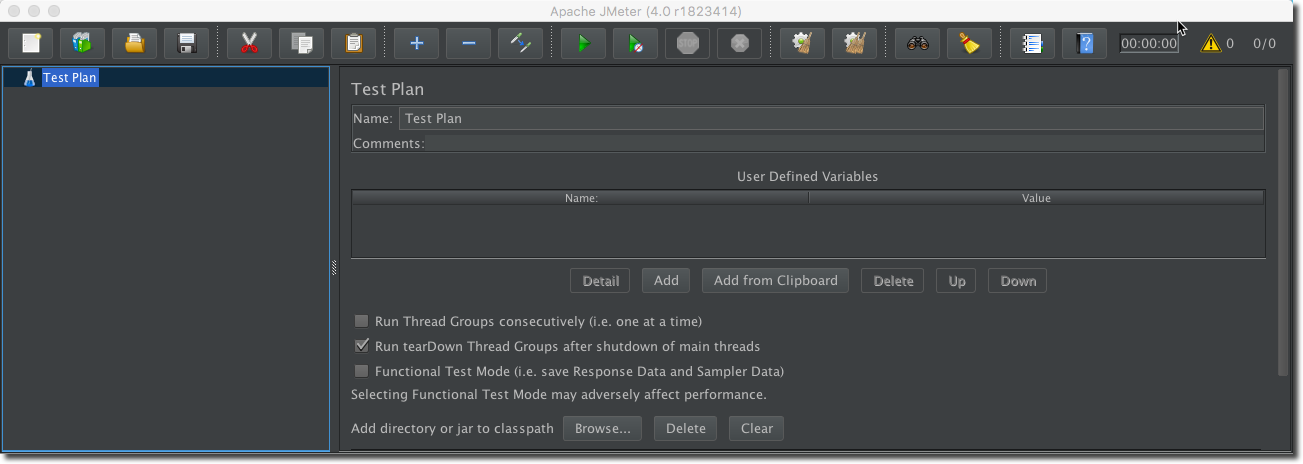
Configuration Pane
You can configure your Test Plan and its element on this window. A Test Plan’s name, user defined variables and its properties can be configured here. Configuring a Test Plan helps you to control its properties and the behaviour in which you would like to run your test Plan as per your requirement.
By default the below screen is visible when we launch JMeter.
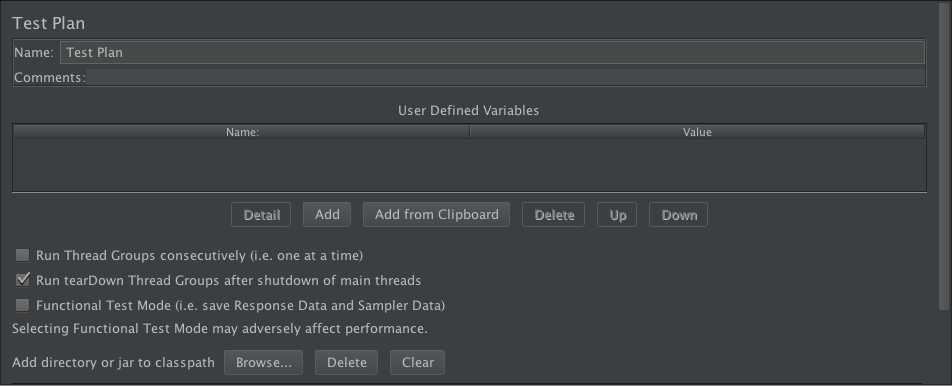
The above screen consists of three major parts:
- Name
- User Defined Variables
- Test Plan Properties.
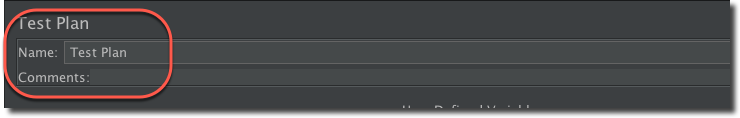
Name
This shows the name of your test plan. You may change the name of your test plan here. We will be discussing how to create, name and save a Test Plan in our next tutorial.
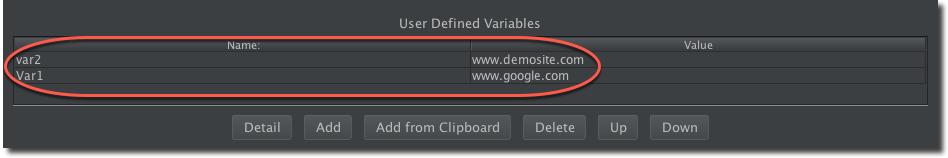
User- Defined Variables
User-defined Variables are nothing but name-value pairs.
You can add a variable by clicking on Add button. You can add multiple name-value pairs either by clicking Add button every time or by using Add from Clipboard button. The following screen shows the added variables along with their values.
Test Plan Properties
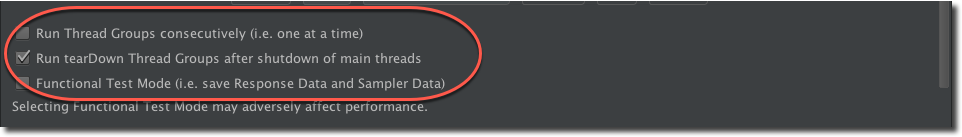
There are three major configuration properties of a Test Plan which you may use to control test plan’s behaviour as per requirement. The three properties are:
- Run Thread Groups Consecutively(i.e. one at a time)
- Run tearDown Thread Groups after shutdown of main threads
- Functional Test Mode(i.e. save Response Data and Sampler Data)
Run Thread Groups Consecutively(i.e. one at a time)
A Test Plan can have one or more Thread Group. It should have at least one Thread Group (which is the minimum requirement) but can have more than one too. If a Test Plan has more than one thread group then they will execute one after the other if this checkbox is checked. If this checkbox remains unchecked then all the thread groups will execute in parallel.
Run tearDown Thread Groups after shutdown of main threads
TearDown threads execute after the test has finished executing its regular thread group. If this checkbox is checked, then this thread will run after the test execution. The tearDown feature is generally used for reporting or cleaning operations. Example, If you want your logs to clean automatically after the execution of a Test Plan or want your reports to be in particular format then you may use this property of the Test Plan.
Functional Test Mode(i.e. save Response Data and Sampler Data)
If this checkbox is selected, then sampler requests and response data are saved in the listeners. Do not worry about the listeners and other technical terms here. We will discuss everything in the later tutorial and this tutorial is just to get you familiar with the GUI of JMeter. This checkbox allows you to verify that the test is working as expected.
Note: A Thread Group is a child element of a Test Plan. Each Thread Group represents a use-case. (We will discuss about Thread Group in our upcoming tutorials)
Menu Bar
This is the upper most bar present on the JMeter GUI. It has many buttons which helps us to perform various function just by clicking the respective button.
We can perform many operations using this above menu bar but discussing all of them here is not necessary. Hence we will only be discussing the most important one. If any other function comes later in the course, we will detail it there.

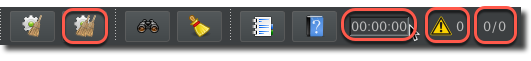
The below images shows the mostly used icons followed by their working.

- New: Using New menu item you can create a new Test Plan.
- Open: To open an existing Test Plan you may use open button present in the menu bar.
- Save: To save the Test plan or its elements you can simply click this button. As you will click this button a prompt appears

- Start: Start icon used to execute the test. After creating a test plan and adding elements to it you may simply click this button to start the execution of your test.
- Start with no pauses: Like Start we can use Start with no pauses to execute the test. Difference between both is that in case of Start No Pause timer configured in the thread group are skipped and the thread will run without any manual pauses.
- Stop: As the name suggests, you can use Stop to abruptly stop the test that is running.
- Shutdown: Shutdown also stops the execution but gracefully. When you shut down the running test it does not stop it immediately but allow the running threads to wind down.
- Clear All: You can clear the log window by clicking Clear All button.
- Elapsed time of current running test: Shows the time taken to execute the test.
- Show Number of Errors in log: On clicking this menu option you will get the logs at the bottom of the configuration window.
- Running thread/total number of threads: this option tells you how many threads are currently running out of the total number of threads.
Hence, in this tutorial we learned about Getting Familiar with JMeter GUI and got to know in detail what is a test plan and what are the properties of a test plan. In the next tutorial we will be learning about how to perform some of the basic operations in JMeter.