

Monitors in Postman is an important feature. It enables you to run your Collections, a set of API tests, to run periodically through out the day. In short, Monitors allow you to schedule your Tests to runs automatically at defined intervals. Before starting with this tutorial I will request you to go back and read the basics of Collections here
What are Postman Monitors?
Rest APIs forms the backbone of modern day distributed applications. It is very important that your API's responses and performance remain up to the mark through out the day. Monitors can help you schedule a Collection of test runs to monitor the Performance and Response of your APIs. Monitors can be scheduled to run very frequently, like every 5 minutes, or can be scheduled to run at an interval of few hours throughout the day.
How to Monitor Collections in Postman?
- Create a collection called Monitoring
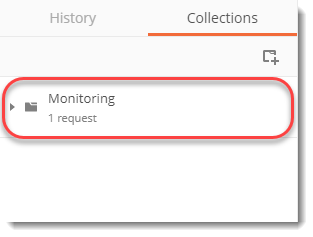
- Enter the weather api requests in it (GET tutorial)
Note: Remember we will be using local variable url in this request. You can recall it from Environment and Variables tutorials.
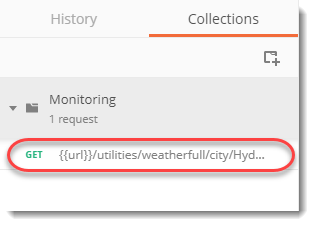
- Open the menu by clicking the arrow button
![]()
- Take a look at the Monitor tab
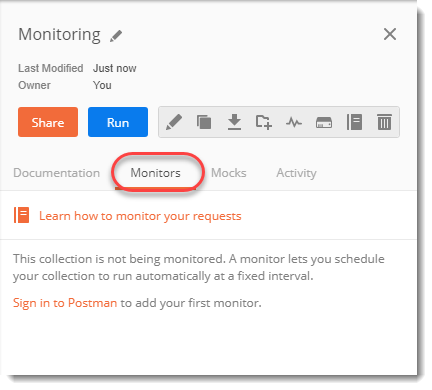
- If you have not signed in to postman, you have to do it now otherwise you won't be able to use Postman Monitor.
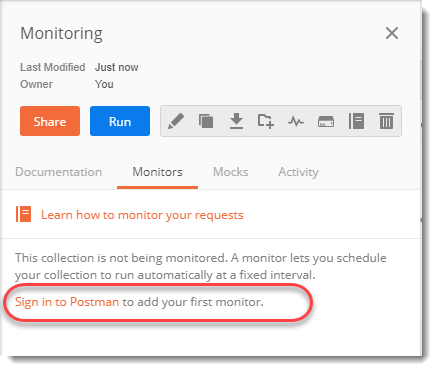
Once you have signed in to Postman, we can create a Monitor to run our Collection.
- Click on Add Monitor
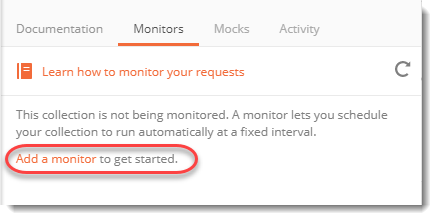
Note: This option only opens after signing in
- You will see a popup as shown in the below image.
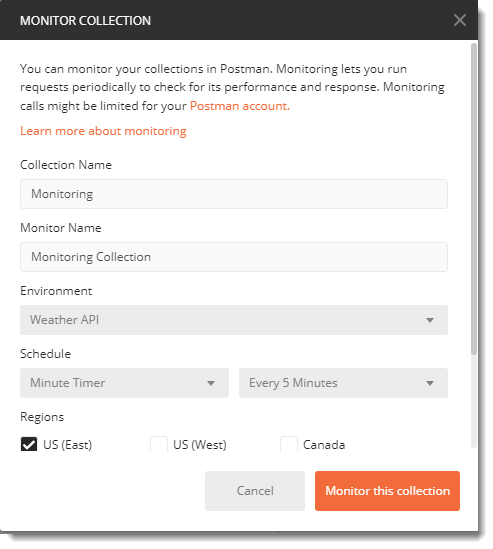
This contains few options to enter such as
- Monitor Name: Monitor name is quite straightforward. It is the name for your monitor. You can name it anything as we here named it Monitoring Collection. You can apply many monitors to the same collection so it would be better if you apply meaningful names to know later what were you monitoring.
- Environment: Environment field allows you to select the environment you want your tests to run. If you had earlier created an environment in Postman then you will find here in the drop down. Just select the one you want. If your scripts are hard coded with environment URLs then you may select No Environment option. Postman monitoring does not allow using Global Environments. If you are using any then you might have to write it again in the local environment. For more details, you can visit Environment and Variables tutorial to learn more about it.
- Schedule: Schedule option is used for scheduling the intervals at which the monitor will run. Since monitors run in specific intervals, you have to set the value accordingly. The options are quite straightforward. You can set minute timer for minute intervals, hourly timers for hourly intervals and similarly there is weekly timer.
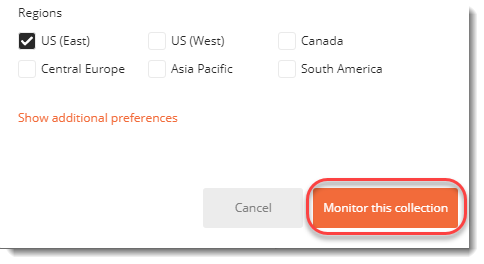
- Regions: Region option is available in monitors to synchronize the timings according to the region. There are several options available for matching the time. We will be using the US (East) region (which is also the default region) just for simplicity. You should use the region according to your physical location for better testing and monitoring.
- Press Monitor this collection
- The monitor will be visible to your monitor console once you press the button in the previous step.
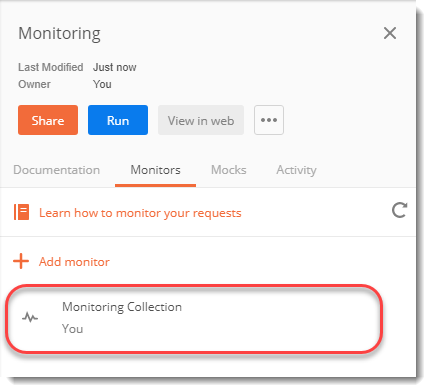
- Once you click the monitor, a new window will open in your browser which will redirect you to your account in Postman. A new console can be seen which looks like the following image.
Now you can sit back and relax and let Postman do its work. You have successfully applied a monitor to one of your collection. Postman will run it according to the schedule you set.
Analyzing Monitor Results
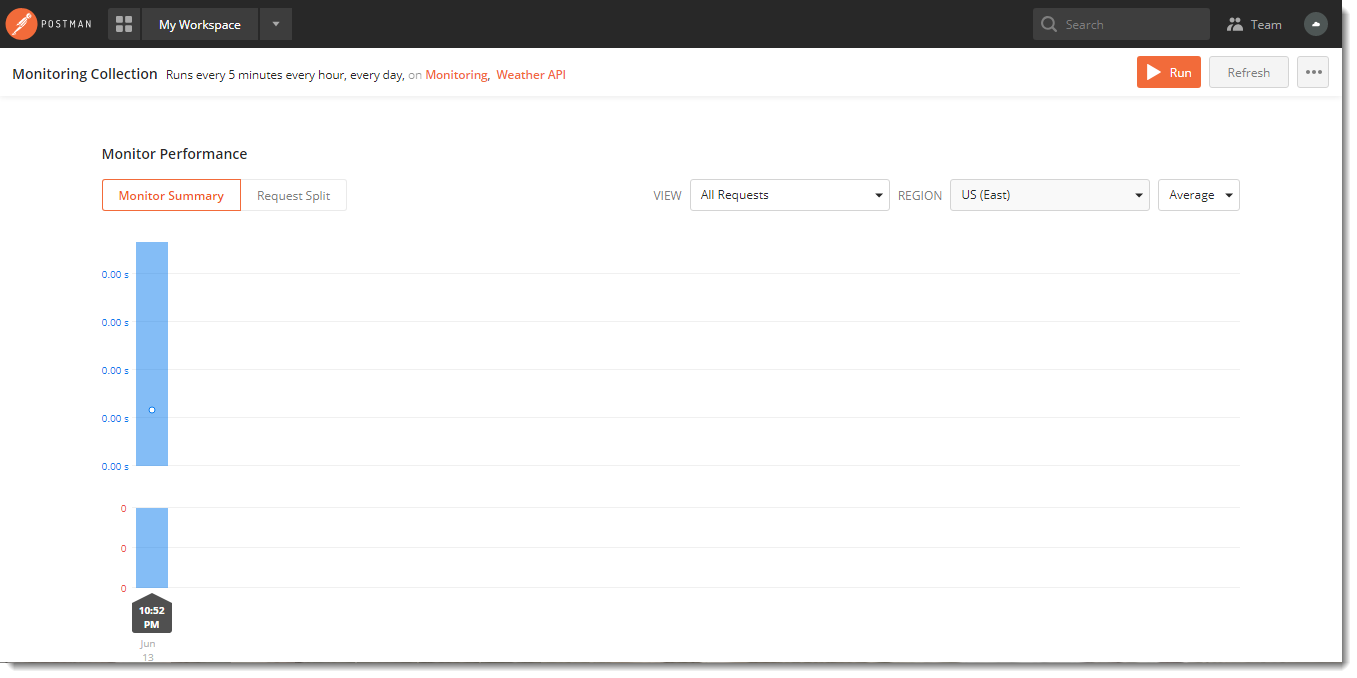
After some time the monitor console will look something like this.
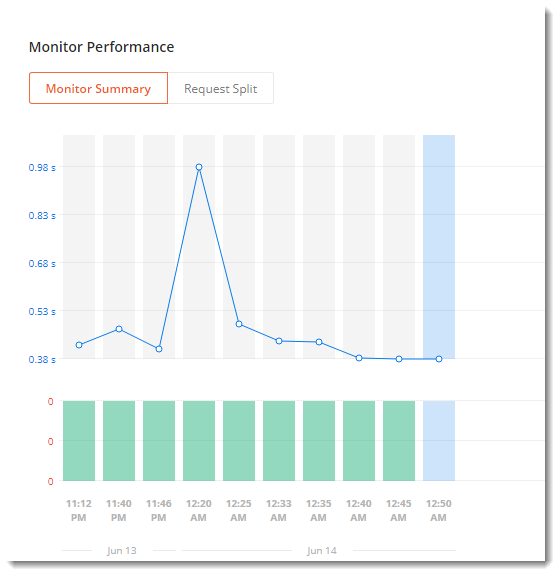
This is an API performance report. The green bars you see depicts that the tests have passed for the request. If you have a failed test the bar will turn into red. The tests need to have assertions in them so that we can catch any issues in the API. You can learn more about assertions here in Assertions tutorial.
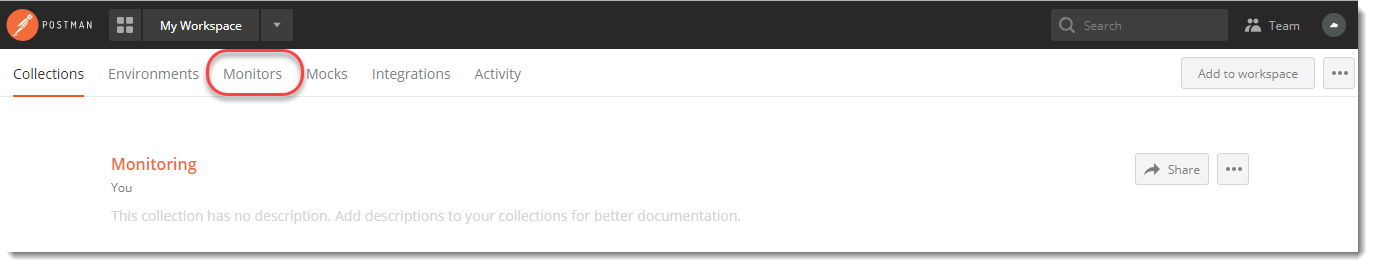
Monitors page can be viewed again by simply login in to postman in your web browser.
You will see the Postman dashboard after logging in as shown in the image below. Click on the Monitors.
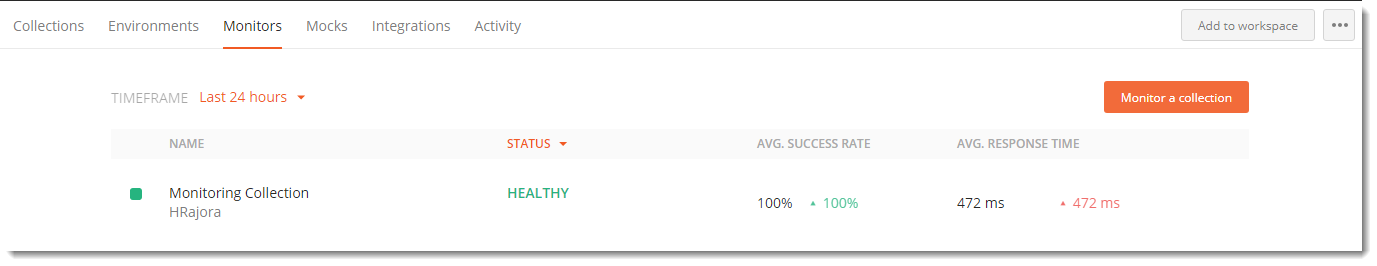
You will see all the monitors in the next window. Here we have only one so we see that one only.
Click on the monitors and the same bars will appear again. You can choose any bar that shows anything wrong to you to have a look at it. For example let say we choose the bar corresponding to 12:55 AM
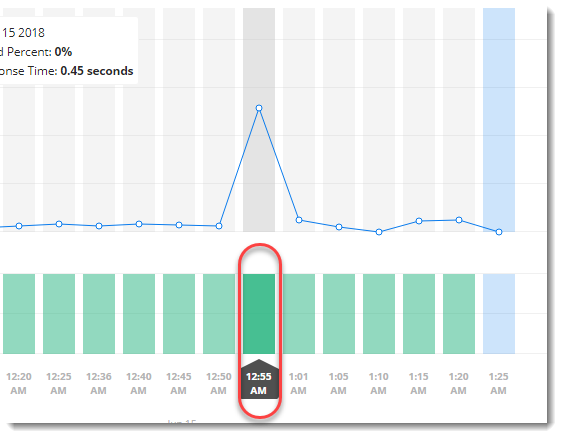
As soon as we click on the bar, the corresponding data appears just below it.
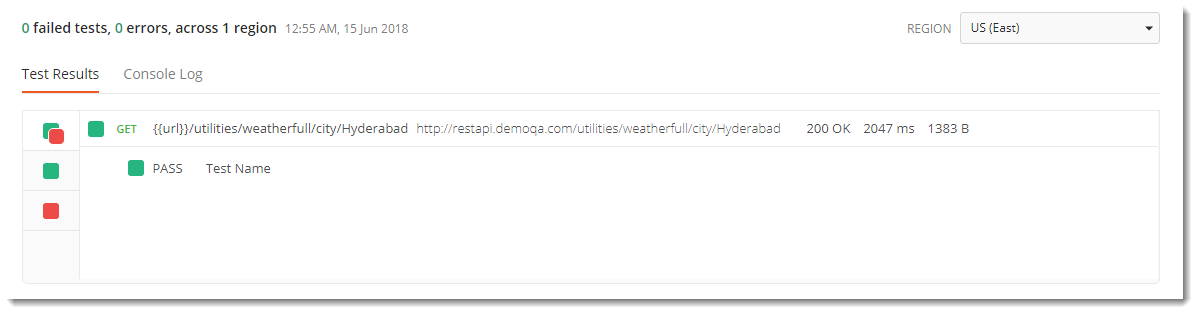
You can look at the data and see different requests, tests, and even error. This is similar to the collection runner console and has similar features. There is also another feature in the response data shown above. If you are more into debugging and looking for particular errors you can look at the console log also.
Click on the console log
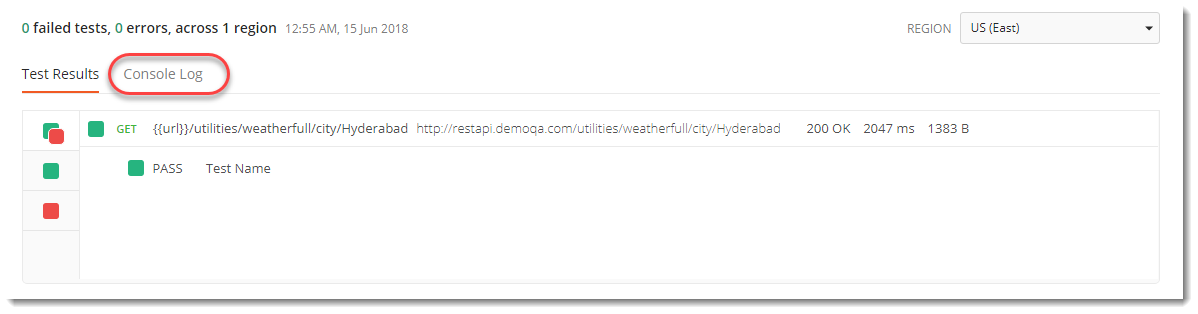
This will show you the console where it has logged the errors and all the logs that were processed. This helps developers and debuggers to know what went wrong. Remember to delete the monitor when you done experimenting with it. With these features monitors is a better way to develop and test but it also comes with some disadvantages.
Disadvantages of Monitors
Since monitors comes with little disadvantages along with its features, it totally depends on you whether it is a problem for you or not. We will be discussing these in brief.
Cannot be used in Postman network
Postman monitors do not work if the postman servers are in the same network as you are. Being in the same network there is a problem that since your network is working you will never be able to diagnose "how will your collection behave in another network", therefore postman monitors are not allowed when located in the same network. But since this is a possible scenario Postman has a solution to that.
If you are in the same network as Postman's then you need to buy the pro version of Postman. Once you have done that, postman will provide you with another ip through which monitors can be run.
Cannot import global variables
As discussed earlier while setting the monitor, global variables cannot be imported into the monitors. Once you are initializing the monitor, it needs only local variables if you are using any. If incase you have global variables, you need to copy them as local variables in a new environment.
Monitor's API call limits
You can initialize and run Postman monitor with your collection but monitor is designed to be a pro only feature in Postman. Free service is to make you familiar with monitors. If you are using the free service like we did in this tutorial, you will get only 1000 API calls per month and that includes every monitor's combined.
You can anytime buy the Postman pro feature to enjoy unlimited API calls through monitors but this disadvantage is only a disadvantage according to you. If you are able to manage your tasks and work within the free version limit, it is well and good.
So in this tutorial we got familiar with Postman monitors and learnt how to use them. We will move on the next tutorial now.