

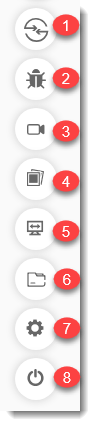
In the last tutorial about real-time testing, we learnt how to run a website in the real-time testing environment. This was done by selecting an appropriate device (desktop and mobile) with the intended version and browser. Although we saw that while we were running the website on the real-time testing environment, a toolbar appeared in the left panel. This toolbar consists of various tools for you to use while you are exploring the website and performing testing. This helps in sharing the bug or take a screenshot on the same screen. It makes the complete process super convenient. In this tutorial, we will explore each of the tools one by one.
I hope you are login into your LambdaTest account and have started your virtual machine as stated in the real-time testing tutorial.
Switch
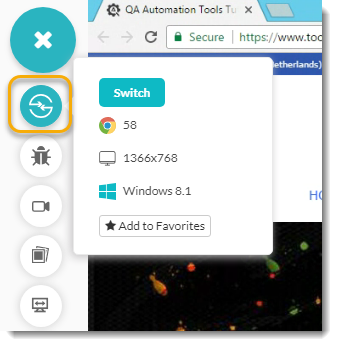
The first option in the tools bar is a switch option. Switch is used for switching the device (or specs) without ending this session and going back to the real-time testing dashboard. Once you click on Switch, It will open up the same panel where we chose the device.
 You can choose the device and specs different from the previous one and run your tests again.
Mark As Bug
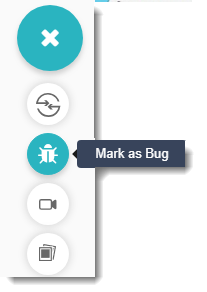
Mark as a bug option is provided for mainly performing two features. When you see a screen that has a bug you can instantly press this tool button and the screenshot will be provided to you. You can then edit the screenshot mainly to mark what the bug is and then can save this on your machine or share it with your teammates. You can also raise the screenshot to the third-party applications which are mentioned below.
- JIRA
- Slack
- Asana
- Trello
- GitHub
- GitLab
- Bitbucket
- VSTS
- Paymo
- Teamwork
- Hive
- Clubhouse
- BugHerd
For doing the above-said operations, follow these steps:
1.Select Mark as Bug from the tool panel.
-
As soon as you click on the button. The screenshot of the currently available (viewable) screen will be taken.
-
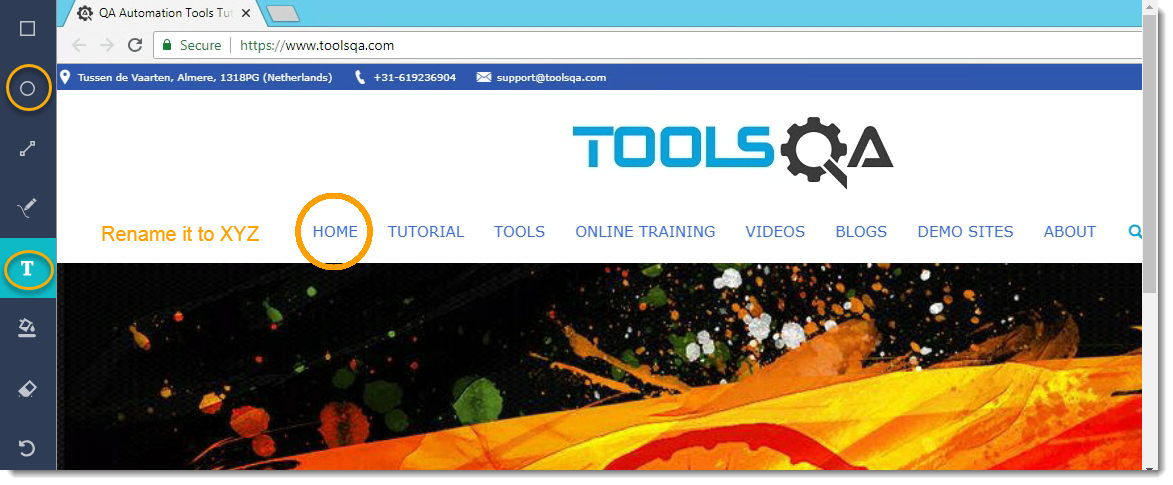
Once this is done, a toolbar will appear on the screenshot in the left side.

This is nothing but the shapes to draw on the screenshot so that you can appropriately mark the bug. The below screenshot is with the round option (2nd) and text option after that to write what the bug is about (5th option marked with T).
- Once you have marked the bug in the screenshot you have few options in the bottom right to go with.
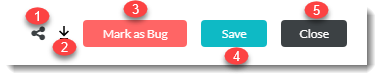
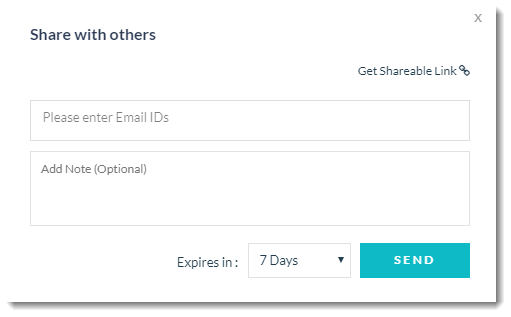
1.Share: It will share the screenshot to any email id (or through the link).
-
Download: It will download the screenshot to your browser's download folder.
-
Mark as Bug: This will share the screenshot to the third party apps or save the issue on LambdaTest cloud.
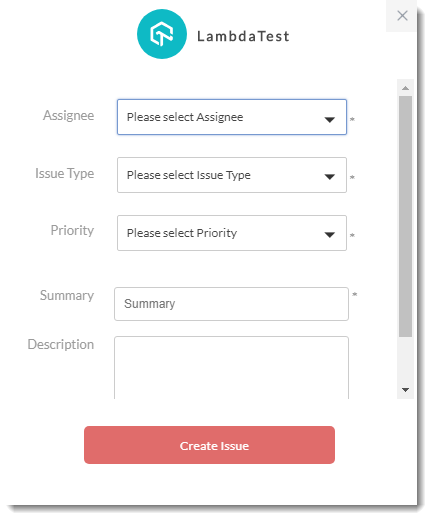
Note: This will create an issue and save it in the issue tracker which we will talk about later on. You can also raise it on the third party apps about which we will talk about in Integrations tutorial.
- Save:This will save the screenshot in the local gallery folder that can be found in the toolbar.

You can click the gallery icon in the toolbar and the screenshot will be available to you. The screenshot will also be available in Test Logs dashboard.
- Close: It will close the process.
Video
Video option is the next option in the toolbar menu of real-time testing.
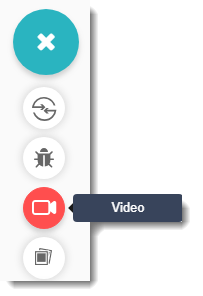
Many times it so happens that the bug is not visible statically on a page and you have to perform some operation to tell that this operation is causing issues. For example, let say while you scroll the website you do not see the top navigation bar. The problem can be much more complex than this. For such problems, you require video support so that the receiving person can see the video and understand the issue. Just click on the video button to start the recording.
You will see the timer alongside once the recording starts.
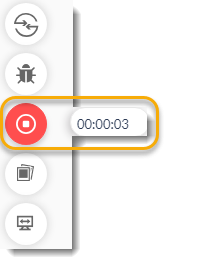
You can stop the recording from the same button once you are done. This video saved in the local gallery like the screenshot from where you can access it.
Gallery
In the previous sections, we talked about the local gallery option. This comes next to the video option.
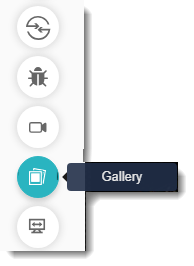
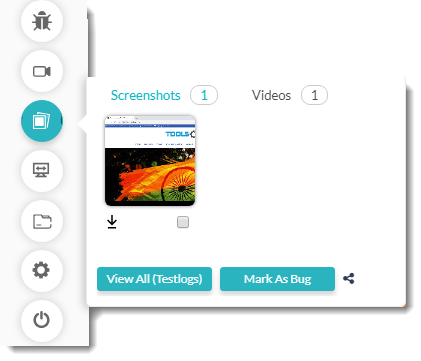
Gallery is used to view all the screenshots and video you have taken during the testing the phase. Once you click on the gallery, you can see two columns, Screenshot, and Video, with their numbers respectively. You can select any column and explore all the screenshot (or video).
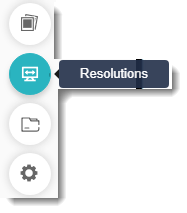
Resolutions
Resolution option is the next option in the toolbar sequence.
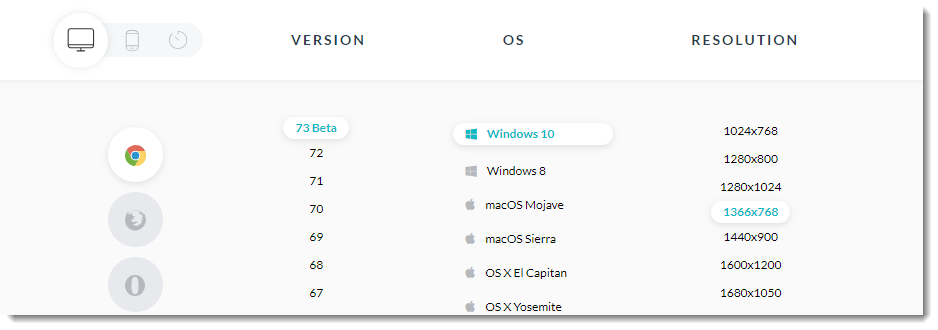
There is nothing to decode in this option. Resolutions, as the name suggests, is used for adjusting the resolution of the screen in which you are looking at your website. Once you click on the resolution, you will get a list of different resolutions.
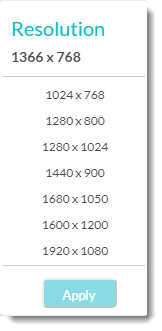
You can choose any of the options and select apply to apply that resolution on to the screen. This way you can see how your website will look in these resolutions without starting a new test.
Project
Project option is used to create your project separately on LambdaTest cloud so that you can see all your test logs at one place no matter how you did it. For example, if you are testing simultaneously on two websites then you can create two projects for the same. Now even though you are switching continuously between the two websites you can see your test logs of one website at one place and the other in another folder.
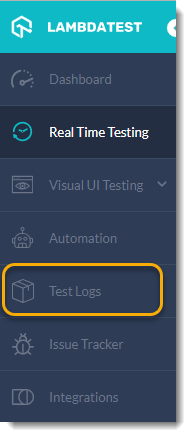
- Select Test Logs from the side menu on your main dashboard.
- Once inside the Test Logs, create a new project.
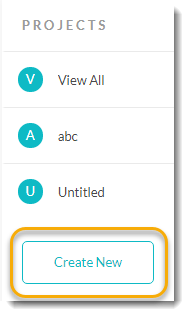
- Name your project and version and press create.
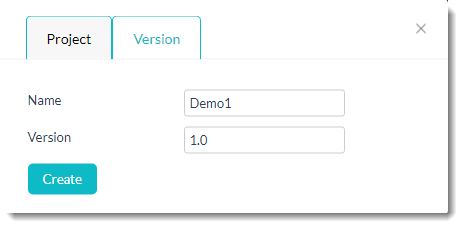
You will be notified once your project is created. Now go to real-time testing and test any website again (like we were doing www.toolsqa.com).
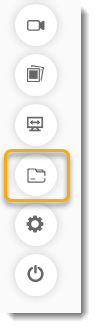
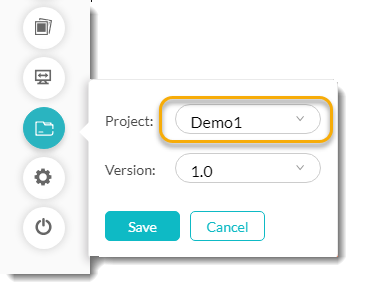
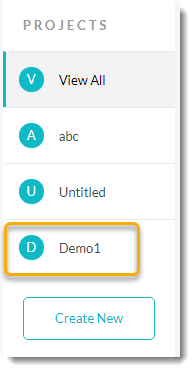
Once you are in the testing environment, select projects from the side toolbar.
- Select the project name we just created and press save.
Now perform the same tasks as we did in the Mark As Bug section and create a screenshot. Once that is done, end the session and you will be back to your real-time testing dashboard.
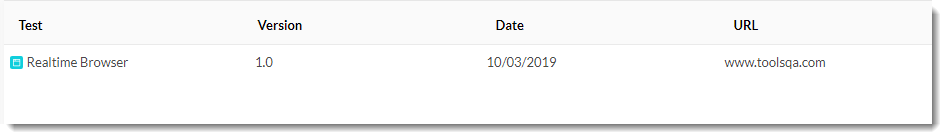
- Go back to Test Logs and select the project name in which you performed the testing.
You will see the test you just performed with the website name.
- Click on this test. It will open up every detail about the user and the test performed. You can also see that the screenshot is available in this test log that we just created.
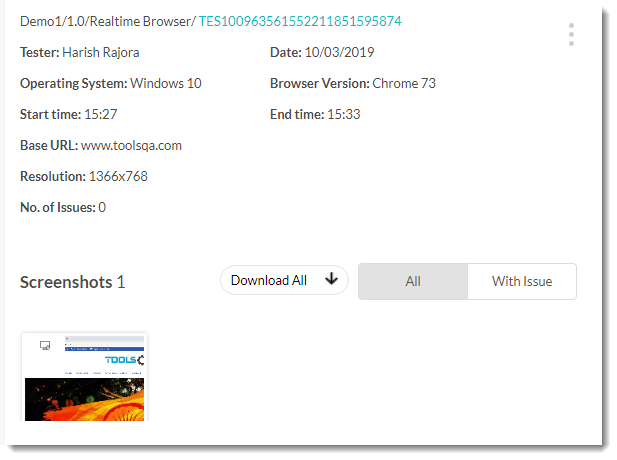
You can create multiple projects and perform multiple tests in each project. You will see every detail about it in your test log. I recommend you to practice this feature for some time.
Settings
Before discussing settings, I want you to remain idle on the screen of real-time testing for 5 minutes. Maybe listen to a song for a while without doing anything on the real-time testing environment. You will notice that when you come back to your screen, you are back to the real-time testing dashboard. This is because the default idle time is 5 minutes while performing real-time testing. This can be changed under settings.
1.Select Settings in the side tool panel.
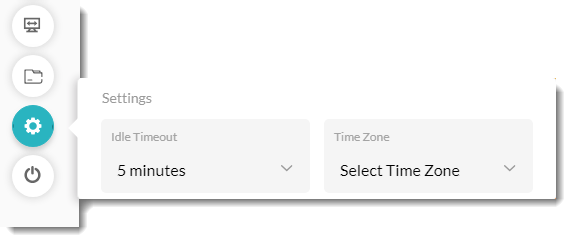
You can change your idle time from the Idle Timeout dropdown and time zone in the Time Zone dropdown. You test time will then be recorded according to your time zone only.
The next option as we have already discussed is about ending the session and returning back to the real-time testing dashboard. It was too many functions in a single go. Real-time testing requires these many functions so that the testing can be done in a way as required. It is also needed so that you can perform the testing in a single window and screen. It is highly recommended that you practice real-time testing for a while before moving forward as it is very important in your journey to learn this tool.