


Generating an easily readable, informative, explicit, and descriptive test report is one of the main goals of any test automation initiative. Without having a straightforward way to understand the detailed results of the automation test run, even the most well-crafted tests will be of little value. Test Reports allow stakeholders to understand the coverage of the tests that execute and the impact of the failed test runs. Additionally, test reports provide one of the earliest indications of the state and health of the application. TestProject provides detailed out-of-the-box test reports, and the reports an integral part of TestProject's infrastructure.
TestProject offers vivid and descriptive test execution reports. Moreover, these reports allow users to keep track of the product's health and quality by measuring passed vs. failed tests over any desired period. Additionally, TestProject also offers testing trend analytics and more drill-down step by step details. The step by step feature allows you to dive deep into each test step and view the failure reason, screenshots, execution duration, and more. Additional features such as the ability to download PDF summary or full report allow users to share these reports with stakeholders easily. Subsequently, let's understand the essential details of the test reports in TestProject in the following sections:
- Understanding the components of the TestProject Reports Dashboard
- What do the Velocity graphs depict in TestProject Reports?
- What do the Distribution and Platform graphs depict in TestProject Reports?
- Similarly, what do the Trends and Targets graphs depict in TestProject Reports?
- What do the Project Details graphs depict in TestProject?
- Understanding the test reports of individual test runs in TestProject
- How to view a detailed report for an individual test run?
- How to export the PDF reports for individual test runs?
Understanding the components of the TestProject Reports - Dashboard
As we discussed in our previous tutorials, the report dashboard can be accessed directly from TestProject's cloud dashboard. Test Reports are automatically generated immediately after each test execution, and we use it for a variety of different purposes ranging from debugging to the analysis of the application's quality. Moreover, to understand the reports dashboard and its various components in more detail, let's first navigate to the Reports module in the toolbar of the TestProject dashboard, as shown in the image below.
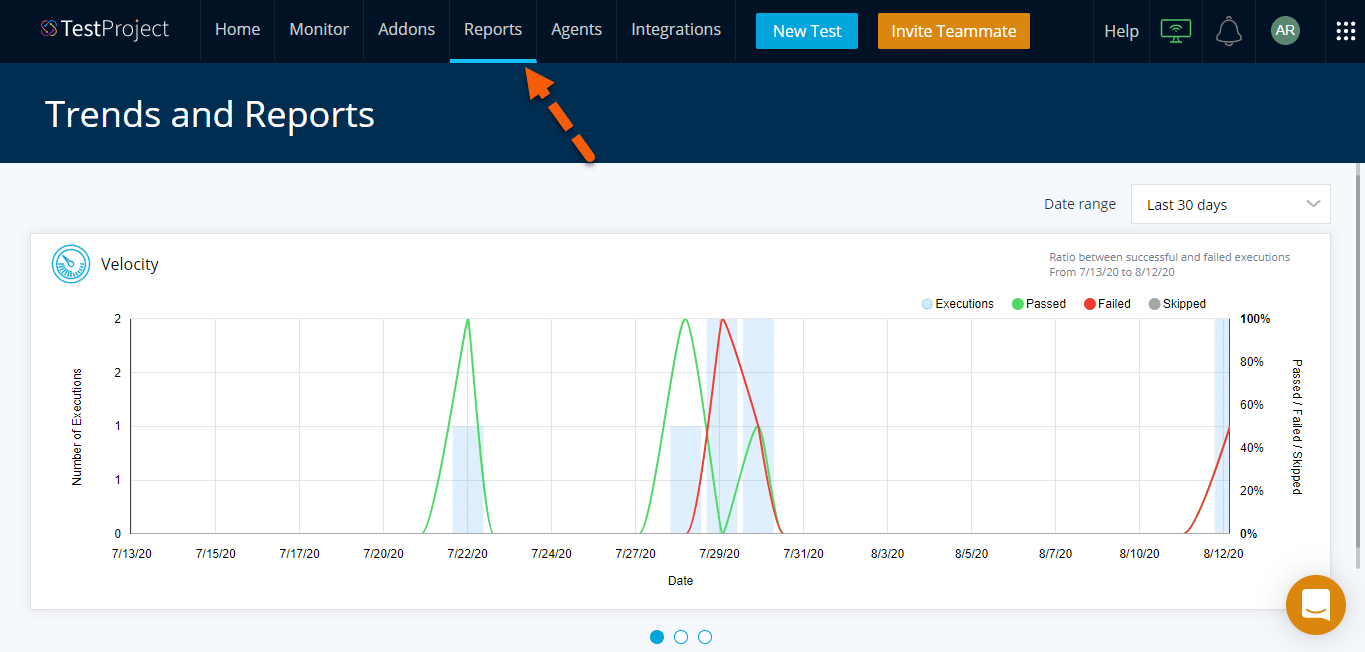
Let's now understand the various component of the Reports module:
What do the Velocity graphs depict in TestProject Reports?
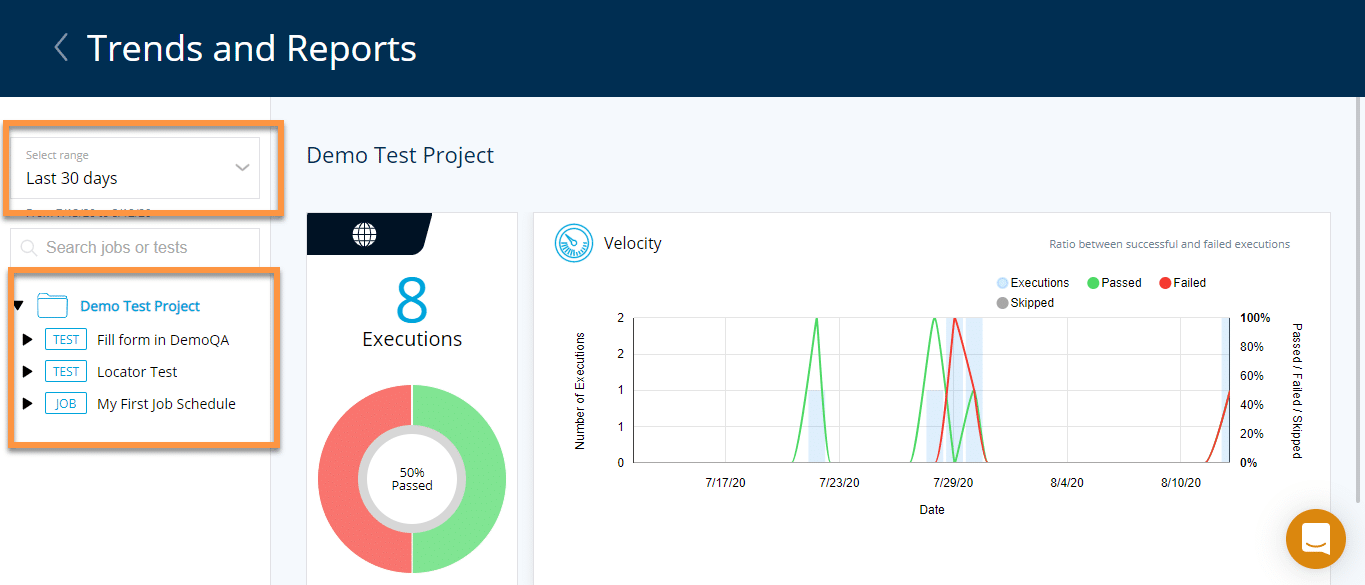
The Velocity graphs in the TestProject contain the Number of execution vs. Date graph. They also show the details of Pass, failed, and skipped test case percentage. Additionally, the green graph represents the passed test executions, and the red graph represents the failed test executions. Similarly, the bar graph, along with the pass/fail graph, describes the percentage of the executions that either passed, failed, or were skipped.
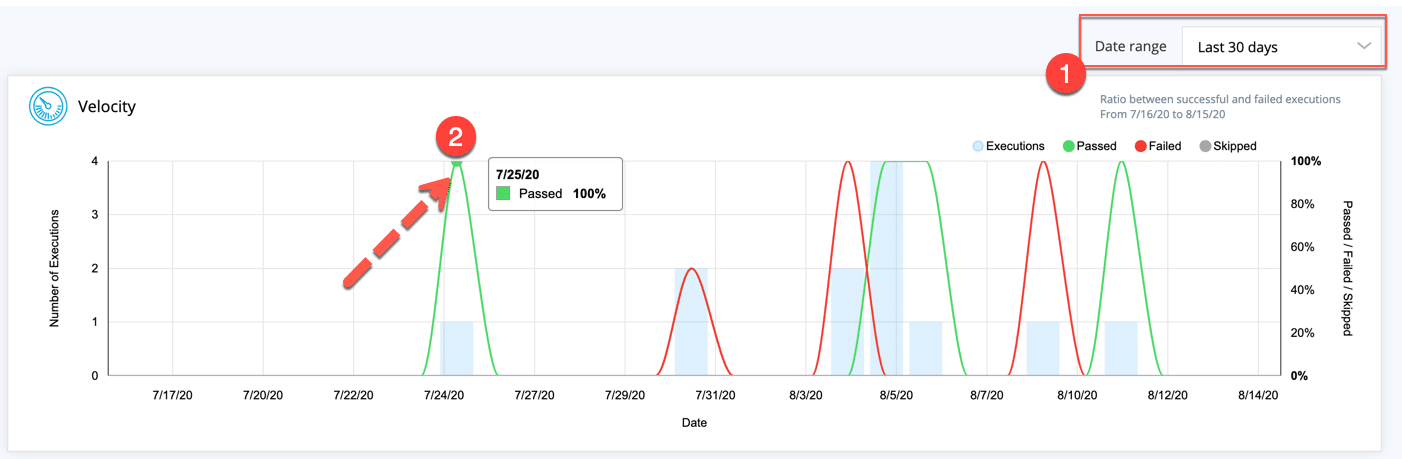
As the number of execution plot against the date of execution, it is relatively easy to understand the application's health over time.
- Date Range: As highlighted by marker 1, these components, i.e., Velocity, Distribution & platforms, etc. allow users to select a date range that can be adjusted based on their needs.
- Data Points Highlighter: As highlighted by marker 2, you can hover over different areas of the graph to see the values clearly, which adds excellent readability to these graphs.
What do the Distribution and Platform graphs depict in TestProject Reports?
To explore the next component of TestProject's test reports, you will need to click on the second dot below the Velocity section, as marked with the arrow in the below image. Once clicked, this will take you to the section named "Distribution". The Distribution section represents the assignment of the test executions across the various agents in your TestProject account.
In our case, we have two test agents associated with our project. Moreover, we can see that on the first agent, "Agent_01 ", we executed a total of 7 test executions. The horizontal graphs also indicate the distribution of pass and fail test executions on the given test agents by distinguishing the test executions with green and red colors.
Another section present on the page is for "Platforms". The Platform section represents the distribution of passed, failed, and skipped test execution performed on different platforms such as web and mobile. For example, in the below image, we can see that for the date range selected, we have only executed the tests on the web platform, so only web-based data is available.
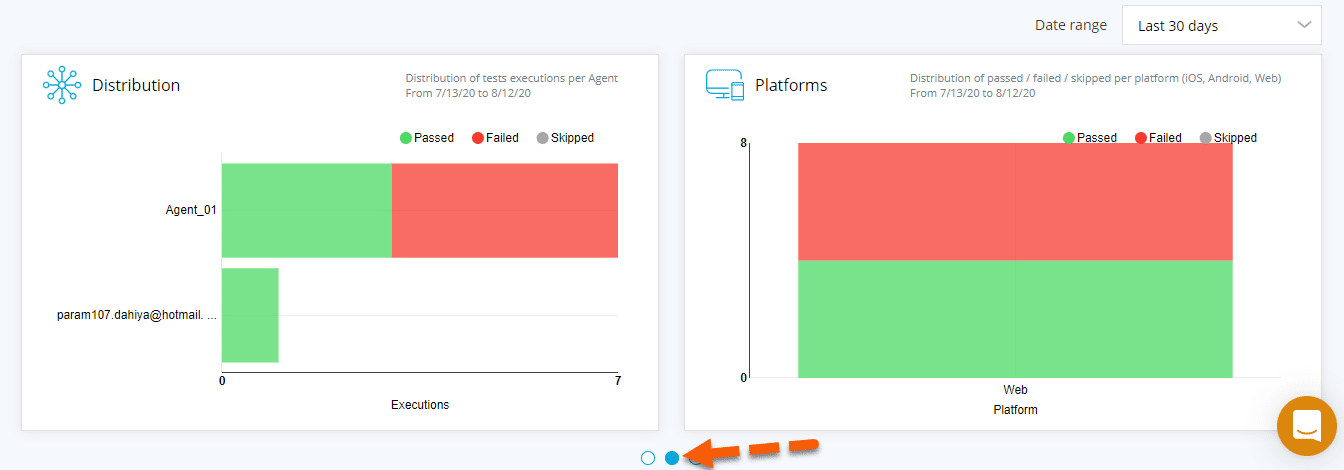
In a nutshell, this section offers a simple view of different agents and platforms used for test execution.
What do the Trends and Targets graphs depict in TestProject Reports?
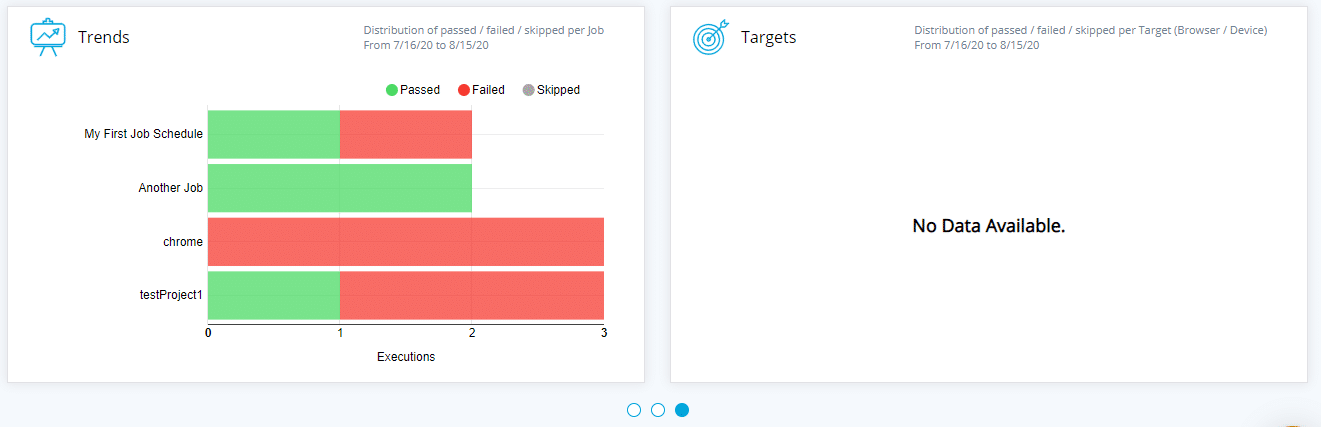
The next section we will explore in the TestProject test reports is the "Trends and Targets " graphs. We can navigate this section by clicking on the last bullet present in the report page, as marked by the arrow in the below image.
The Trends section represents the number of test cases that execute on each of the scheduled jobs. Additionally, all the passed, failed, and skipped test cases for each job are represented as a horizontal bar graph, and the green and red sections on each bar graph represent the passed and failed test executions for the completed job. For example, as shown in the below screenshot, we have different job schedules that execute several times.
The Targets section shows charts that provide a summary of the number of tests executed across different devices.
What do the Project Details graphs depict in TestProject Reports?
The last section of the Reports page is the Project Details section. You will need to scroll down to the bottom of the report page to view this section. Moreover, this section gives high-level information about the project-wide execution details. For example, we have only one project, "Demo Test Project", so the same displays here. Similarly, if you have multiple projects in your account, this section will show details across all of your projects.
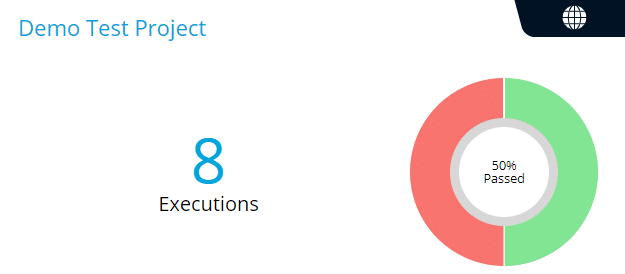
This section provides information, such as the total number of executions within the project and a pie chart representing the pass/fail percentage of total test executions.
Understanding the test reports of individual test runs in TestProject
Individual test reports are the execution details of each test execution. In other words, it offers a drill-down report for each test run and a job that executes. Additionally, these reports are complete with all of the information required to figure out the causes of failure.
Before we discuss more details about these reports, let's first navigate to the individual report page. The first step is to click on the project name in the project section on the report page to navigate. It is as highlighted by the arrow in the below image:
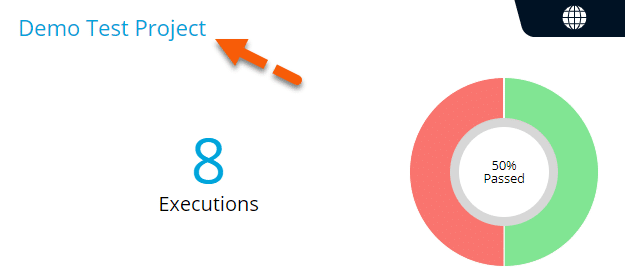
Once you have clicked on a project name, this will open up the project execution detail page as shown below:
The project chart is available as a summary of all the tests that execute for the current project. It also allows the user to filter the data based on specific criteria. Subsequently, below are the ways to effectively filter and quickly search across execution reports.
1.* The "Select Range" drop-down has options for quick filtering the data based on a date range. Additionally, it allows users to create a custom date range and view any execution details within a given date range.* 2. The "Search jobs or tests", as marked in the above image, can be used to search jobs or tests by using them as keywords in the search field. Moreover, it will return all of the matching tests and job details.
Let's now see how we can get the various reports related to the individual test runs:
How to view the detailed report for an individual test run?
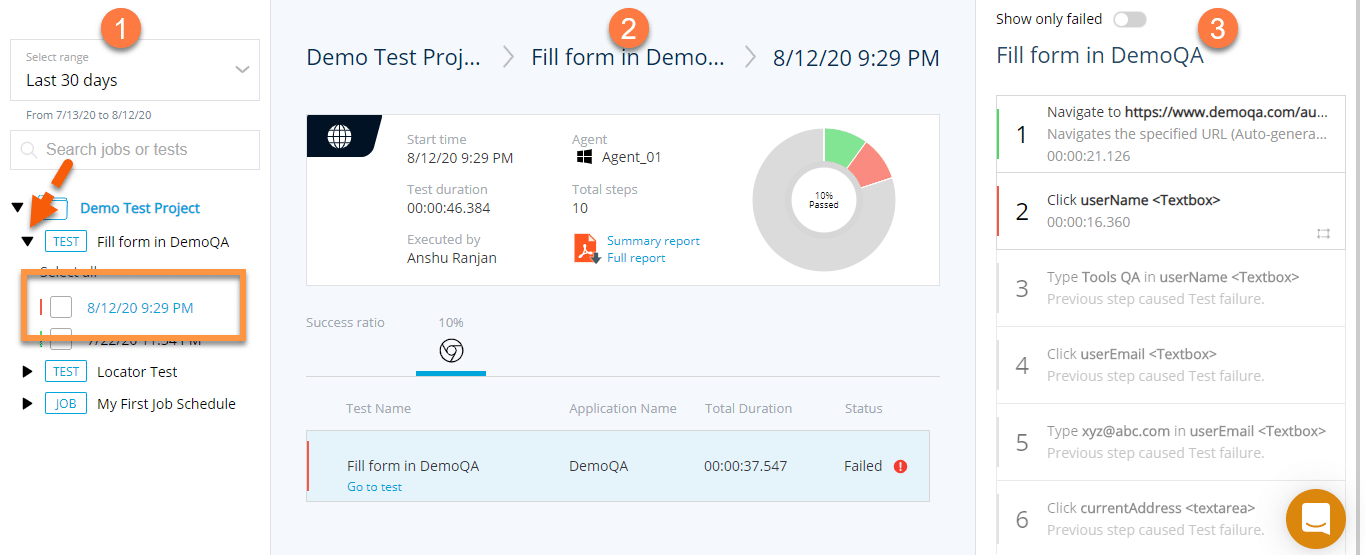
To view the detailed report for a specific test, click on the Test Name in the left side panel, as shown by the arrow in the below image. Moreover, it will open up a list of all the executions of a particular test, as indicated by the rectangle in the left side panel. The test executions are organized based on their execution dates and time. Additionally, click on one of the test execution times, and it will open up the detailed report of the selected test run, containing the following details:
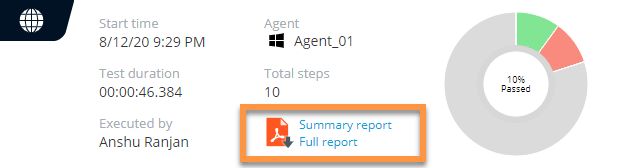
- The first panel of the report (marked by marker2 in the below image) shows the following details related to the test run:
- The start time of the test run.
- The total duration of the test run.
- The agent name on which the test executed.
- The total number of test steps executed in the test run.
- Who executed the test cases?
- The link to download the summary report and Full report.
- Pie chart showing the pass/fail percentage.
- The second panel of the report(marked by marker 3 in the below image) shows all steps of the executed test.
Apart from the details on the panels, TestProject provides several PDF reports as well, which can be very handy when sharing the test results with various stakeholders. Let's understand the details of these PDF test reports:
How to export the PDF reports for individual test runs?
As we mentioned above, the test execution detail reports contain a link to download the Summary and Full reports, as shown in the below screenshot:
Let's understand the details of each of these reports:
What does the Summary PDF Report depict in TestProject?
The Summary PDF Report contains the same information which displays on the Individual Test Report page. Consequently, a sample PDF report will appear like the below:
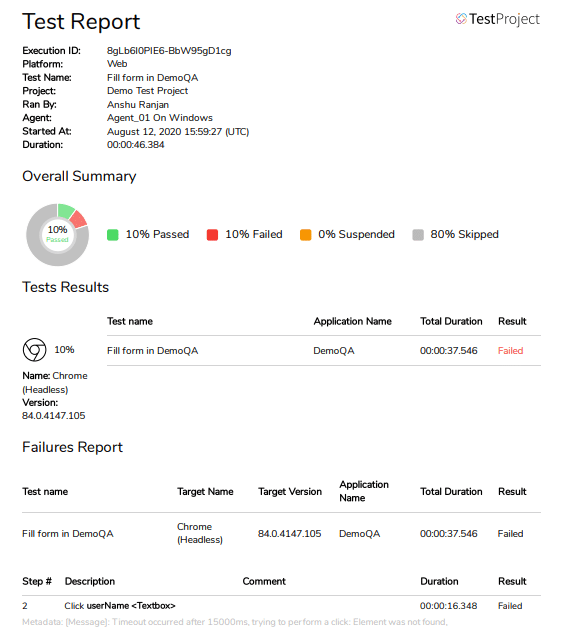
As we can see, the Summary Report gives us an overall summary of the test execution, showing the following details as defined below:
| Field | Details |
|---|---|
| Execution ID | Shows the unique execution ID assigned by TestProject to the test run. |
| Platform | Shows the platform on which the tests execute. |
| Test Name | Name of the test which we executed. |
| Project | Name of the project from which we executed the test. |
| Ran By | The name of the user who runs the test. |
| Agent | The test agent on which the test executed. |
| Started At | The time at which the test execution started. |
| Duration | The overall duration for which the test executed. |
| Overall Summary | A summary showing the percentage of passed, failed, suspended, or skipped test steps. |
| Test Results | Showing the details of Test Name, Application name, Total duration of the test, the overall status of the test execution, and the browser/device on which the test executed. |
| Failures Report | Showing details of the test steps which failed during the test execution. |
What does the Full PDF Report depict in TestProject?
The Full PDF report is a more in-depth view of the test execution. The first page of the report contains nearly all of the details of the Summary Report. Similarly, the second page includes the step by step details of the test execution. Moreover, it will also include details such as screenshots and the duration of individual test steps. The second page of the Full PDF report will look like the below:
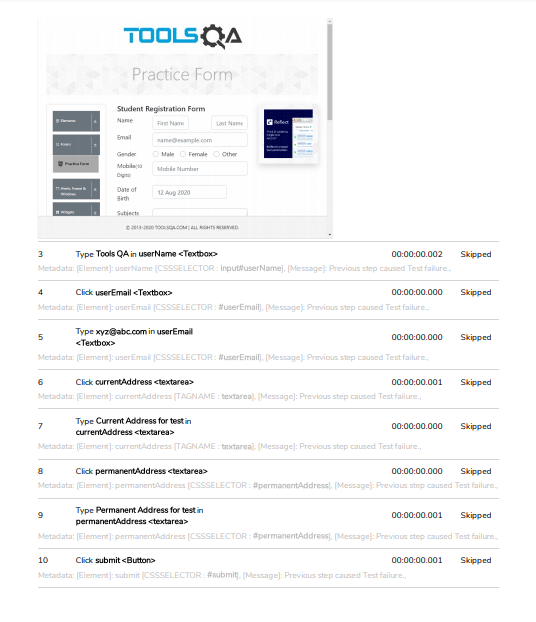
As we can see, it shows the screenshot and the status against each of the test steps in the test execution.
Now, we understand the various information contained in the reports provided by TestProject. Additionally, we can also receive PDF reports via email and evaluate the quality of the application quickly with their help.
Key Takeaways
- TestProject provides various types of reports which help the user to understand the quality of the application under test quickly.
- Moreover, Charts like velocity, distribution, platform, trends, and targets in TestProject give a holistic picture of the execution status and application state for a given period.
- Additionally, the individual test reports in TestProject are the test specific execution reports that contain all the details of particular test execution. Moreover, you can view information like duration, pass/fail, user, browser, etc. or you can deep dive into the individual steps to get a detailed analysis for debugging.
- Also, TestProject also allows users to generate full and summary PDF reports which can be shared with the stakeholders as desired.