


Constructing a complete test suite requires a lot of test cases spreading in all directions with the objective to scrutinize each corner of the project. In this complete process, generally, we look forward to seeing a green color mark against all the test cases indicating their successful execution with a "Pass" status. However, as much as we long for this scene in the test report, occasionally, a red mark appears indicating that a test has failed in testRigor. Out of hundreds of successful tests, this one catches our attention quickly because of the nature of a failed test.
A failed test case exposes the bugs in the application or sometimes issues with the test case itself. If a newly created test has failed, there may be a chance that the test was incorrect. But, if an old test case failed, it might be an indicator of a bigger problem. Whatever it is, a failed test case can only be debugged and corrected when we have adequate information in our hands. And this information can only be retrieved if we know exactly where to look. Hence, in our next step of working in testRigor, let's try to fail a test case and explore how we can fix it.
Table of contents
- Executing a failed test case in testRigor
- Analyzing a failed test case in testRigor
- Last Run Option in testRigor
- Errors tab
- Reports tab in testRigor
- Tree view in testRigor
- Captured data tab in testRigor
Executing a failed test case in testRigor
First, we'll need a failed test case, which is easy to construct. We just need to put down a validation that will intentionally return false during execution. However, this may need a little knowledge about validations in testRigor and executing a test case. We recommend going through these chapters for more information.
For this demonstration, we will be targeting the demoqa.com website and specifically, its "forms" pages. The execution steps would be as follows:
- Accessing the URL.
- Clicking the Forms tab.
- Clicking the Practice Forms tab.
- Validating the URL pattern.
The above steps can be converted to testRigor understandable language as follows:
click "Forms"
click "Practice Form"
check that url contains "new form"
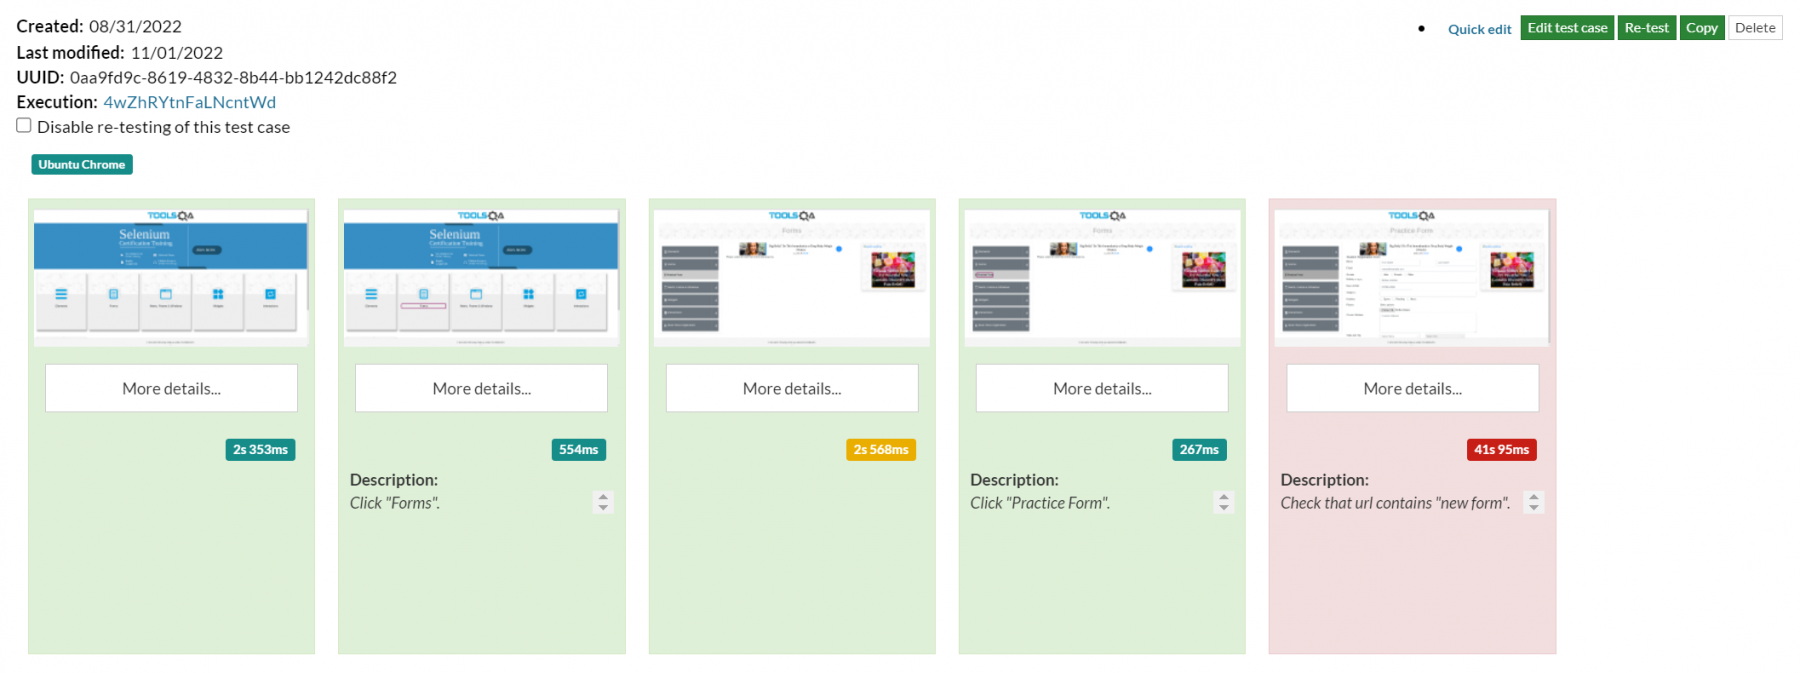
Run the test with the above instructions and the test should fail. This status is recognized by the "result" tab on the right corner of the test case panel that shows "Failed" in red color.

Alright! Now we know our test case has failed and we need to dig a little deeper to understand the cause. Let's see what else we get from testRigor when a test case fails.
Analyzing a failed test case in testRigor
When a test case fails, the first thing we need to know is the step that halted the test execution. This step will lead us to the cause of the problem. To know this, press the down arrow located beside "Failed" as seen in the above image to open the screenshots which testRigor automatically captures during the test execution.
From this image, it is clear which test step has failed - Validation of the URL.
This is because we checked for "new form" in the URL. However, such a string is not present in the URL which is "https://demoqa.com/automation-practice-form".
So now, we can move our focus from the entire test case with multiple steps to one single step. Click on More details... to check what else testRigor has captured in this instruction for us.
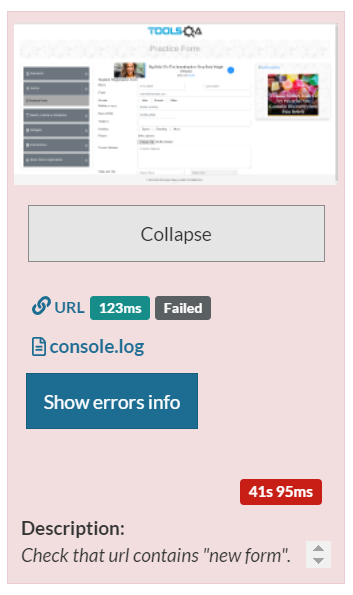
The button reveals a few options for us to look into. The first one is the URL which is the URL of the web page on which the test has failed. Since we moved successfully from the landing page and forms page, this will redirect us to the "practice-form" URL.
The second link is to a log file named console.log. If we click on this link, a zip file downloads to our local system that contains the log file. When we open this file, we can see the server logs imprinted on the text document captured during the test case run. This is extremely important when the bug arises not from the UI side but from the backend. For instance, while debugging, we can put some debugging statements to observe the variable values on the console and trace our way to the cause of the bug. These values are visible on the console which can be looked at in this console.log file.
For our current bug, the first thing we look at is the instruction we passed and the actual URL on the screen which obviously is a mismatch. Therefore, we can refrain from analyzing the log file in this demonstration.
Finally, the "Show errors info" button is visible. Let's click this button and check if it displays something relevant to the URL failing.
When we click this button, a modal pops up displaying the error information:
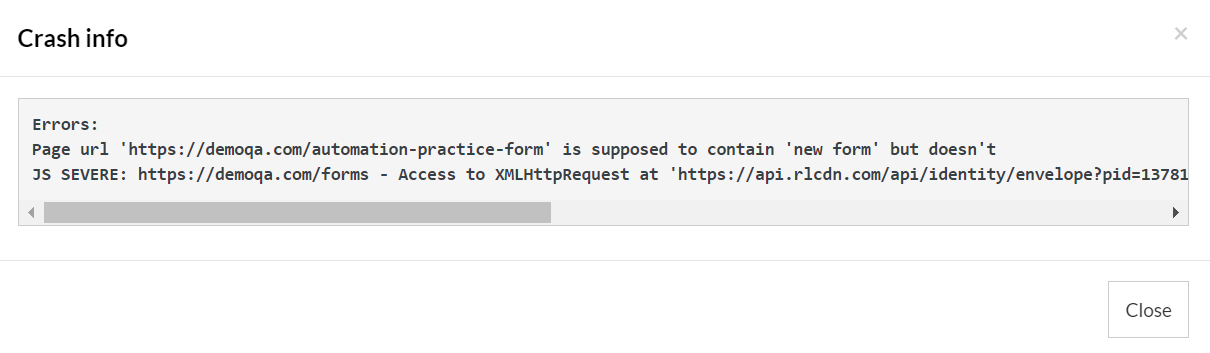
This info shows us two errors:
- The first error is explicit and resolves our issue. The error clearly states the problem with the string and how it doesn't match the actual URL.
- The second error is a cross-origin error which is better conveyed to the developer as it involves header additions on the web page.
With this information, we are now clear about what went wrong and can debug the issue right away. For conventional developers, this is not as easy as it is with testRigor. When we code automation test cases, we need to debug them using temporary variables, debugging statements, and much more. There we do not have any assistance as with testRigor that shows which window failed on exactly which step. Therefore, we end up spending much more time in conventional automation testing in maintenance and debugging than we do with testRigor.
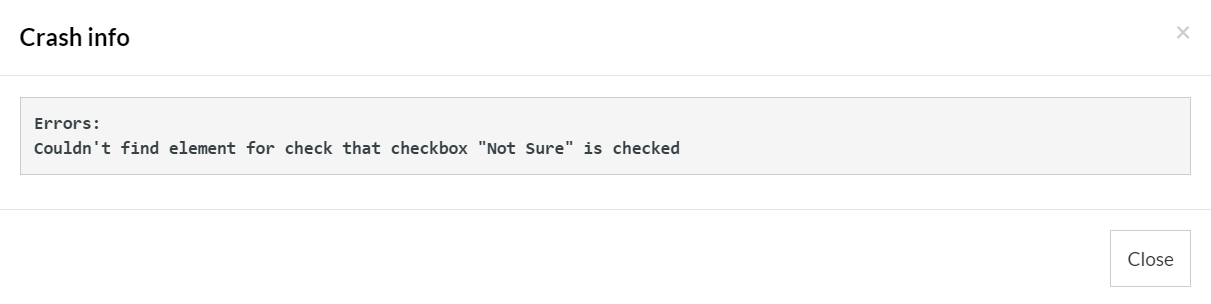
Let's consider another example. If we change the validation from URL to checkbox as follows:
check that checkbox "Not Sure" is checked
And now re-test with the new instruction, we will see a different and specific crash info to help us out:
Now it's time for you to practice! Try out some test cases with multiple purposely incorrect validations and be aware of errors that arise due to failed tests in testRigor.
Last Run Option in testRigor
All the details we've looked into in the above sections come directly from the "Test Cases" tab from the left side tool panel. This shows all the test cases and test executions done during a specific interval of time. In general, it is the entire pool of our work done on the web application in the current test suite. But a lot of the time, we just need to focus on the last run of the test case(s) and analyze only this part of the pool. This is achieved through the "Last Run" option in testRigor.
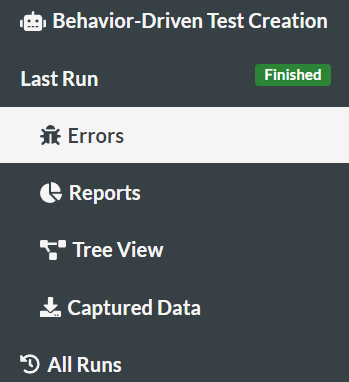
To access the "Last Run" option in testRigor, notice the option on the left tool panel:
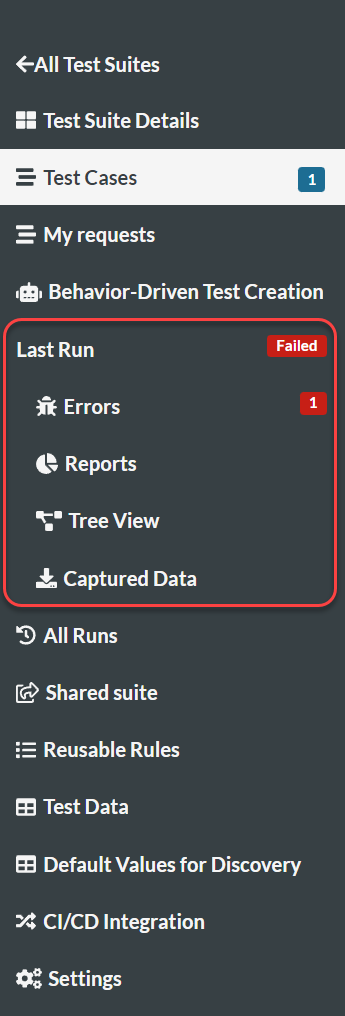 For quick access, this option shows a few options ready to be viewed below the "Last Run". Since they have dedicated pages on testRigor, let's see them one by one.
Errors tab in testRigor
The first option in this panel is the "Errors" tab. As the name suggests, it shows the errors that occurred during the execution. Before clicking this option, you can also notice the total errors the last run in testRigor has raised. In the image above, we have got only one error which we have already analyzed in the previous section.
Click the "Errors" tab to open the "Errors" page:
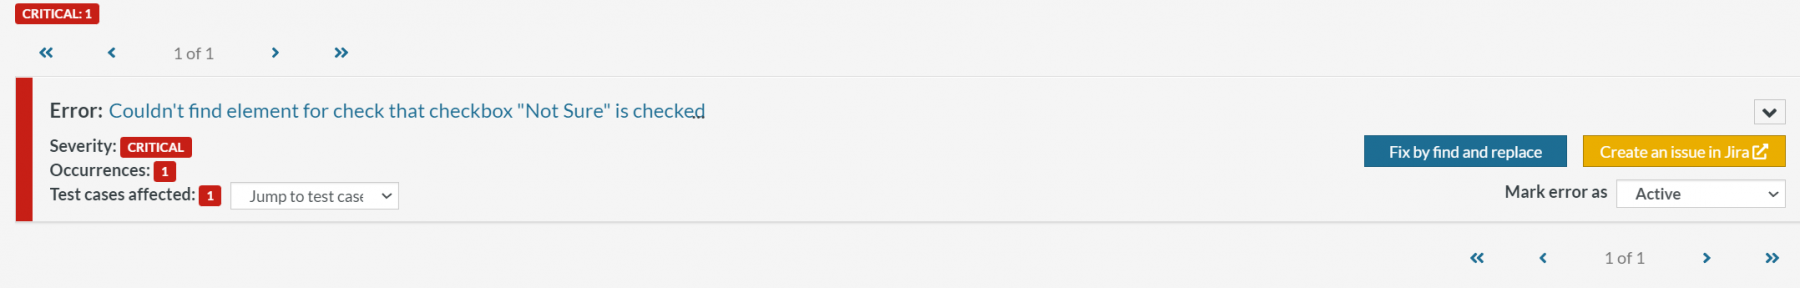
The main page shows one error in our last run. Notice that the "Error" headline written as "Couldn't find element for check..." is the same error that was available in the crash info modal.
The other options shown on this page are:
- Severity: This is the severity of the test case that depends on many factors and analyzed by testRigor through their internal mechanism depending on the failed test.
- Occurrences: The number of times this same error has occurred in the complete last run.
- Test cases affected: The number of test cases affected due to this error.
On the right side, we have three options as follows:
-
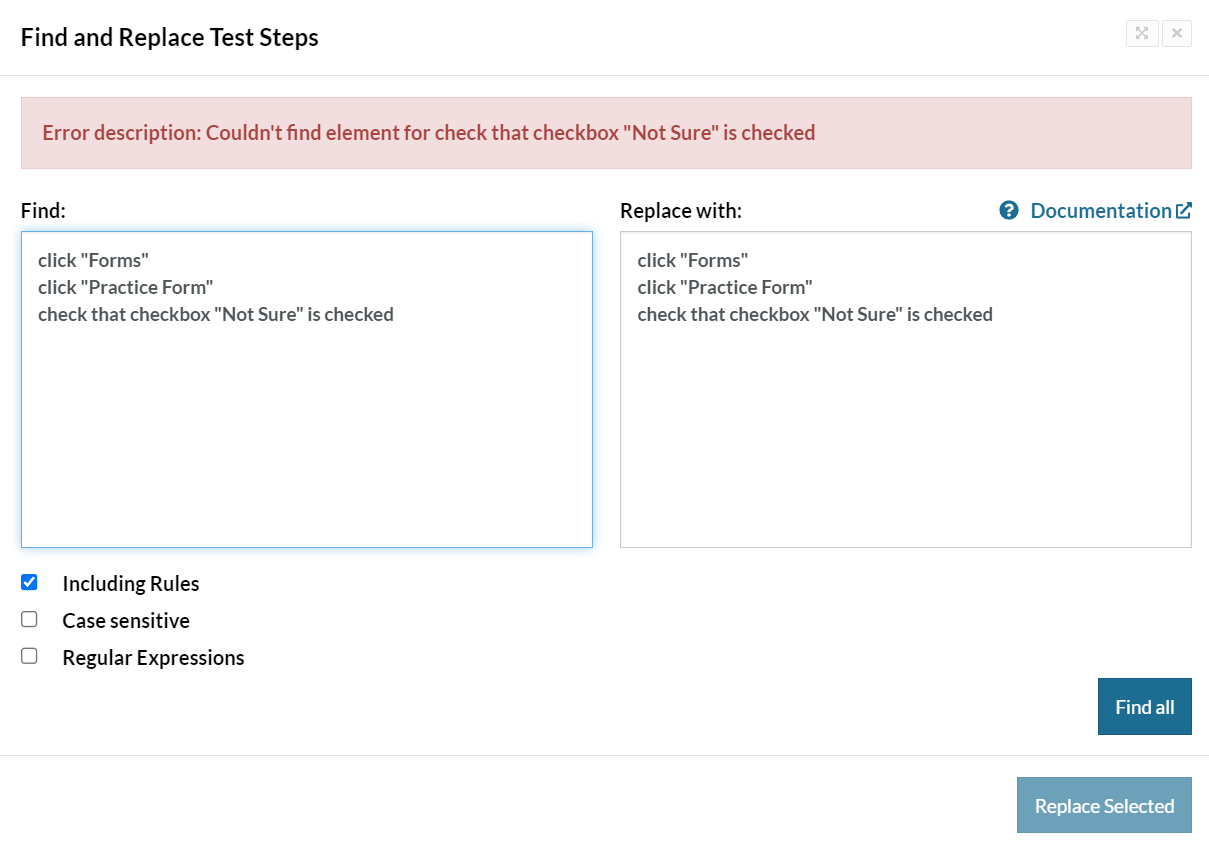
Fix by find and replace: This option asks for replacing the failed instruction steps with the new ones as per your choice. Clicking this option opens a new modal to let you enter new instructions. This is particularly helpful when you'd like to modify multiple test cases, and will save you a lot of time.
-
Create an issue in Jira: As the name suggests, this will take you to the Jira website and ask for your credentials where you can create a ticket with this error on the project.
-
Mark error as: This option asks for you to mark the error as either in "Active" state or "Known issue". The default state is the "Active" state. However, if you mark the error as a "known issue", testRigor understands that it has previously occurred and hence there is no point in counting this particular occurrence as a bug. Hence, this option will erase the issue from the left side as well.
 Once we have analyzed the errors tab, we can move on to the "Reports" section.
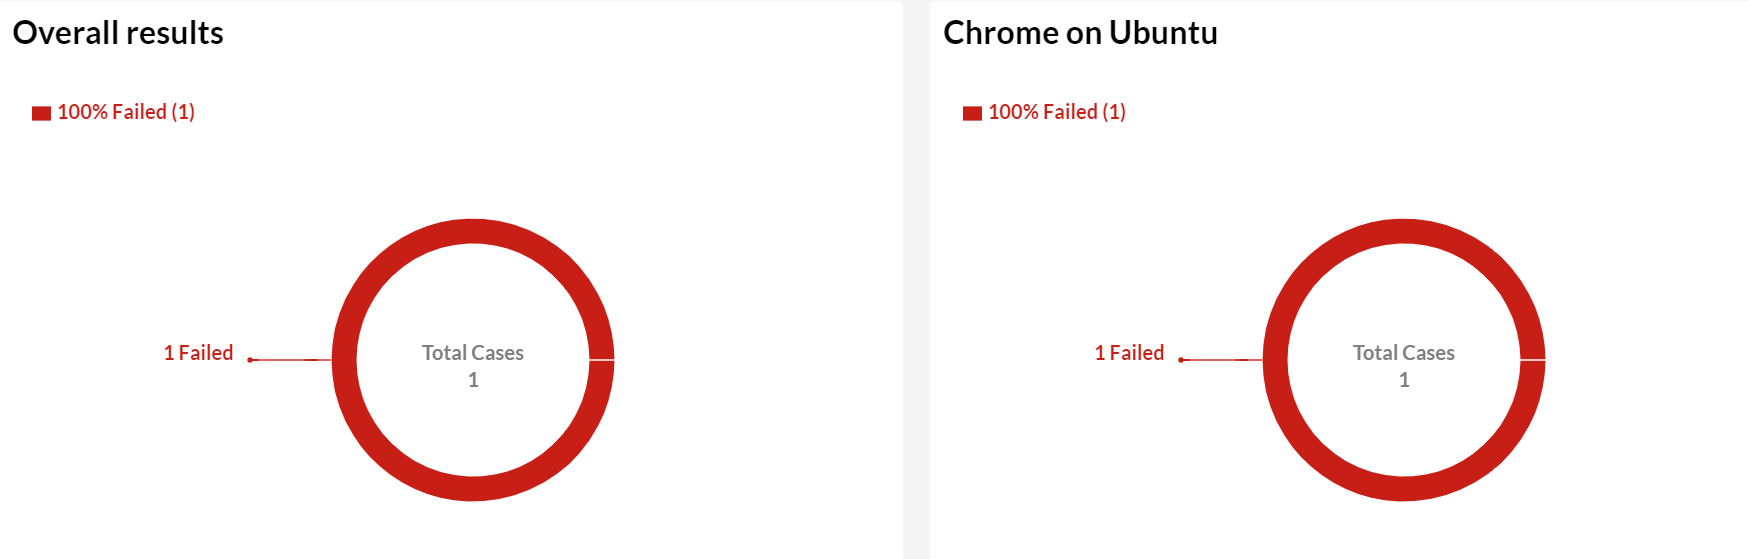
Reports tab in testRigor
The reports tab located just below the "Errors" tab contains the test case report of the suite last executed. It represents platform-wise failed and passed tests. Since in this demonstration we only executed one test case, we get the following report:
Just to demonstrate the changes we would see here, I have added a second (valid) test case. The changes on the report tab are as follows:
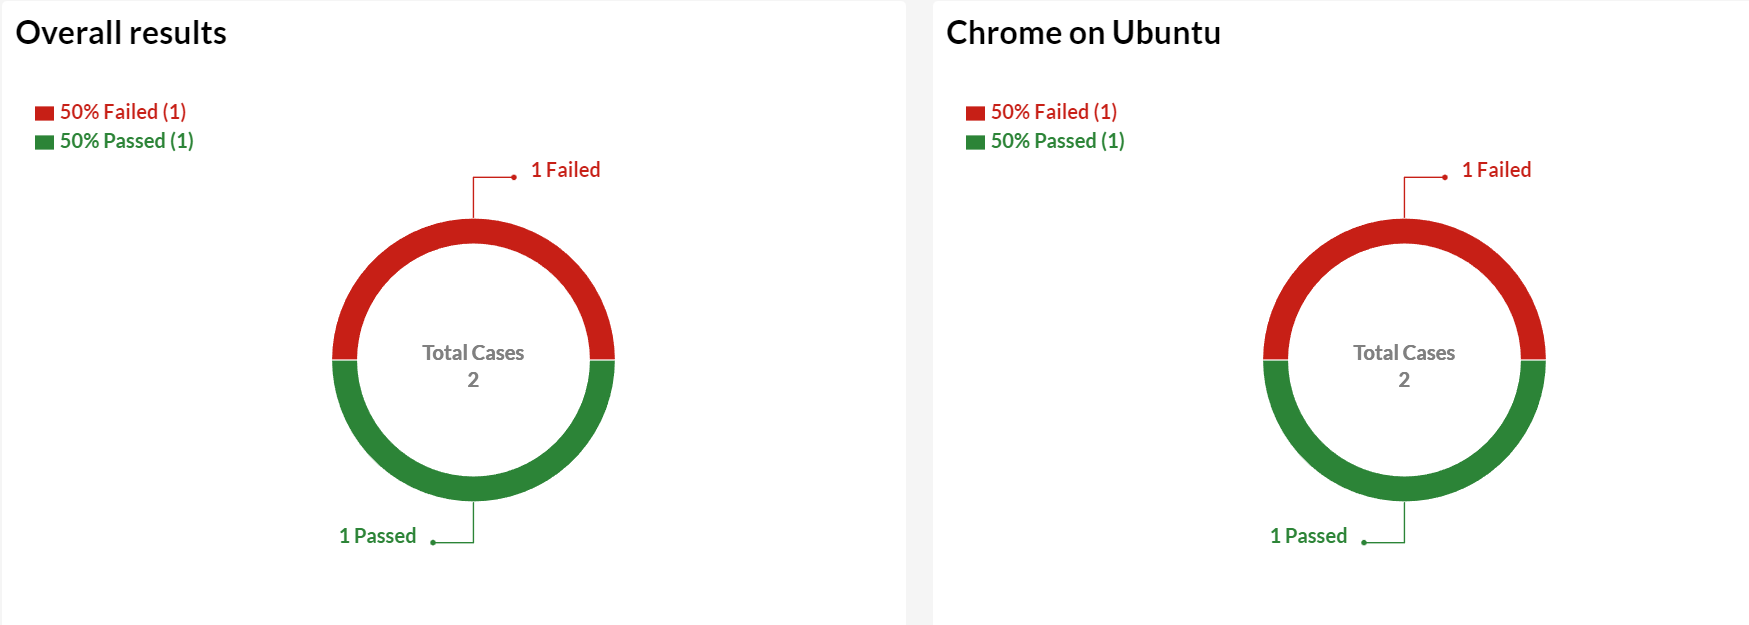
This gives a gist of what we could expect with hundreds of test cases.
Tree view in testRigor
One of the most interesting and unique concepts in testRigor is the tree view. This option shows a tree structure of the executed steps during the test run. It starts with the first screen which is the starting point of the test:

This will also be the case if the starting URL does not open i.e. the URL is wrong, etc.
Click on the left arrow to expand the tree to the next step:
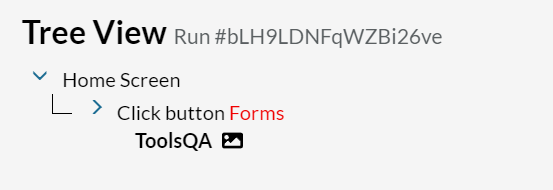
The next step shows the action that testRigor took i.e. "Click button Forms" and the title of the page on which this action executed i.e. "ToolsQA". Besides the title, an image icon is visible which shows the screenshot of that screen highlighting the clicked button. This is similar to the screenshot shown in the Test Suite dashboard.
Expand this step for the next step of "Click button Practice Form" where our test ended due to an error.
The tree view is an excellent visualization when the test case contains hundreds of steps to execute. It gives the tester a serial view of test steps and helps visualize the flow of tests along with screenshots. This reduces the time to debug and ultimately wraps the testing phase faster.
Captured data tab in testRigor
The final option available to us is the "Captured Data" tab. This screen shows the captured data during the test execution and provides an option to bind them into a zip file to download to your local system. Since in this test run, there were no such files, the screen will be empty here.
What's next?
This brings us to the end of this post about failed test cases in testRigor and fixing them to run successfully. Recapping a bit, we learned about how we can recognize a failed test case in testRigor through the test case dashboard. When we do, we can expand the details and look a bit deeper with the help of window screenshots and error messages provided by the test platform. We can also bulk update multiple test cases which are using the same elements.
Since the test case dashboard contains a complete collection of the test cases, we can move on to the "Last Run" tab to focus just on the last execution of test cases. The "Last Run" tab provides us with four useful options that help us inspect the failed test in testRigor. These options are Errors to display the error message and replace strings in instruction steps if needed, reports to get visual reports with diagrams for quick reference, tree view to get a step-by-step view of test execution, and captured data to get the data captured during the test run. All this was discussed in this post in detail with a simple demonstration.
As we complete this post, we conclude our learnings on test cases and how to create and fix one in testRigor. I hope you can perform complex testing scenarios on the web applications now. From here, we move on to variables, their role in testing and how can we use them in testRigor.